Good Rankings, Wrong Probabilities: A Calibration Audit of Multimodal Cancer Survival Models
The full paper is available as a PDF here: https://arxiv.org/abs/2604.04239
Abstract
Multimodal deep learning models that fuse whole-slide histopathology images with genomic data have achieved strong discriminative performance for cancer survival prediction, as measured by the concordance index. Yet whether the survival probabilities derived from these models - either directly from native outputs or via standard post-hoc reconstruction - are calibrated remains largely unexamined.
We conduct, to our knowledge, the first systematic fold-level 1-calibration audit of multimodal WSI-genomics survival architectures, evaluating native discrete-time survival outputs (Experiment A: 3 models on TCGA-BRCA) and Breslow-reconstructed survival curves from scalar risk scores (Experiment B: 11 architectures across 5 TCGA cancer types). In Experiment A, all three models fail 1-calibration on a majority of folds (12 of 15 fold-level tests reject after Benjamini-Hochberg correction). Across the full 290 fold-level tests, 166 reject the null of correct calibration at the median event time after Benjamini-Hochberg correction (FDR = 0.05). MCAT achieves C-index 0.817 on GBMLGG yet fails 1-calibration on all five folds.
Gating-based fusion is associated with better calibration; bilinear and concatenation fusion are not. Post-hoc Platt scaling reduces miscalibration at the evaluated horizon (e.g., MCAT: 5/5 folds failing to 2/5) without affecting discrimination. The concordance index alone is insufficient for evaluating survival models intended for clinical use.
1. Introduction
Multimodal deep learning models that fuse whole-slide histopathology images with genomic profiles now achieve concordance indices of 0.60-0.82 for cancer survival prediction. Models such as MCAT (Chen et al., 2021), SurvPath (Jaume et al., 2024), and MMP (Song et al., 2024) represent genuine advances, with potential for clinical risk stratification.
But there is a gap between ranking patients and advising them. The concordance index measures whether a model correctly orders patients by risk. It says nothing about the probabilities these models assign. When a model outputs "30% five-year survival," that number may reach a clinician, a tumor board, or a patient. If it should have been 60%, the consequences are concrete. In one simulation study, a confidence-calibration framework reduced clinician override rates to as low as 1.7% for high-confidence predictions (Yu et al., 2025), suggesting that well-calibrated AI outputs may strongly influence clinical decisions. If those outputs are miscalibrated, the influence persists but the guidance is wrong.
Calibration - the alignment between predicted probabilities and observed outcomes - bridges the gap between a useful ranking and a trustworthy prediction. Tools exist: D-calibration and 1-calibration (Haider et al., 2020) test whether predicted survival distributions match observed event rates, implemented in SurvivalEVAL (Qi et al., 2023). Yet across the leading multimodal WSI-genomics survival models, formal calibration has received little attention. MCAT, SurvPath, MMP, PORPOISE (Chen et al., 2022), and MOTCat (Xu et al., 2023) all report only C-index.
Concordance metrics are used 10x more frequently than calibration metrics (Lillelund et al., 2025). The FDA's January 2025 draft guidance recommends calibration statistics and uncertainty measures for higher-risk AI applications.
Our contributions:
- First systematic fold-level 1-calibration audit of multimodal WSI-genomics survival architectures across 5 TCGA cancer types. 166 of 290 tests reject calibration after multiple testing correction.
- Fusion method is strongly associated with calibration quality. Gating preserves it; bilinear and concatenation do not.
- Platt scaling recovers much of the lost calibration without affecting discrimination.
- A validated pipeline with positive and negative controls.
Generalizable Insights
Three insights extend beyond survival prediction. First, discrimination and calibration are independent properties that must be evaluated separately. Second, architectural choices appear to carry unintended calibration costs. Third, evaluation norms shape what gets optimized - a single ranking metric has created a blind spot across an entire subfield.
2. Related Work
2.1 Multimodal Survival Prediction
MCAT (Chen et al., 2021) introduced cross-attention between genomic feature groups and WSI patch embeddings. SurvPath (Jaume et al., 2024) tokenizes transcriptomics into biological pathway representations. MMP (Song et al., 2024) compresses >10,000 WSI patch tokens into 16 prototypes. Related models include PORPOISE (Chen et al., 2022), MOTCat (Xu et al., 2023), and CMTA (Zhou et al., 2023). Nearly all evaluate exclusively via C-index. MADSurv (Zhang et al., 2025) is a recent exception.
A systematic review of 48 studies found all showed unclear or high risk of bias (Jennings et al., 2025). None reported formal calibration evaluation.
2.2 Calibration Evaluation in Survival Analysis
Haider et al. (2020) introduced D-calibration and 1-calibration, implemented in SurvivalEVAL (Qi et al., 2023). Goldstein et al. (2020) proposed X-CAL. Lillelund et al. (2025) found calibration metrics used 10x less than concordance. The A-calibration framework (Simonsen & Waagepetersen, 2025) showed D-calibration becomes conservative under heavy censoring.
SurvBoard (Wissel et al., 2025) and Tran et al. (2025) benchmark calibration for tabular models but neither includes WSI-based models.
2.3 Uncertainty Quantification for Deep Survival Models
NeuralSurv (Monod et al., 2025) is the first deep survival model with Bayesian UQ, tabular only. M2EF-NNs (Luo et al., 2025) applies Dempster-Shafer theory but lacks calibration evaluation. No existing work conducts a systematic 1-calibration audit for multimodal WSI-genomics models.
3. Methods
3.1 Models Evaluated
Experiment A evaluates three models on TCGA-BRCA (1,004 patients, 149 events, 85.2% censoring), trained with UNI2-h (Chen et al., 2024) 1,536-dim patch embeddings, 5-fold CV, 20 epochs. All three use NLL survival loss over 4 discrete time bins (our MMP uses NLL for consistency; the original MMP paper uses Cox partial likelihood loss).
Experiment B evaluates 11 architectures using pre-computed results from Chen et al. (2021) across 5 TCGA cancer types with UNI v1 1,024-dim features.
3.2 Calibration Evaluation Protocol
All metrics computed independently per fold. Survival curves: SurvPath uses interpolated discrete hazards; all others use Breslow estimation with KM baseline from training fold. Metrics: C-index, 1-calibration via SurvivalEVAL at median event time, IBS. D-calibration excluded (lacks power for 4-bin discrete outputs).
3.3 Controls
- Positive: Cox-PH (1-cal p = 0.08, PASS)
- Negative: Shuffled predictions (1-cal p = 0.0001, FAIL)
- Breslow validation: KM-shift vs lifelines (Davidson-Pilon, 2019) produce p = 0.079 vs 0.078
3.4 Post-hoc Recalibration
Cross-fold Platt scaling (Platt, 1999): fit on other folds' validation sets, apply to full survival curves, evaluate with SurvivalEVAL. No data leakage.
4. Results
4.1 Modern Models on TCGA-BRCA (Experiment A)
All three models fail 1-calibration on a majority of folds. MCAT is the worst: p < 0.001 on every fold. SurvPath rejects all five at raw alpha = 0.05, with four surviving BH correction. MMP passes on one fold (p = 0.233); of four raw rejections, three survive BH correction.
| Model | Fold 0 | Fold 1 | Fold 2 | Fold 3 | Fold 4 | Fails |
|---|---|---|---|---|---|---|
| SurvPath | 0.018 | 0.033 | 0.000 | 0.000 | 0.001 | 5/5 |
| MCAT | 0.000 | 0.000 | 0.000 | 0.000 | 0.000 | 5/5 |
| MMP | 0.233 | 0.037 | 0.012 | 0.000 | 0.000 | 4/5 |
Table 1. Per-fold 1-calibration p-values (raw). Two borderline cases (SurvPath fold 1, MMP fold 1) do not survive BH correction.
| Model | C-index | 1-cal fails (BH) | IBS |
|---|---|---|---|
| SurvPath | 0.669 +/- 0.063 | 4/5 | 0.223 +/- 0.117 |
| MCAT | 0.645 +/- 0.057 | 5/5 | 0.311 +/- 0.229 |
| MMP | 0.598 +/- 0.081 | 3/5 | 0.120 +/- 0.032* |
Table 2. Summary metrics. 1-cal fails after BH correction (FDR = 0.05). *MMP fold 4 IBS (3.81) excluded.
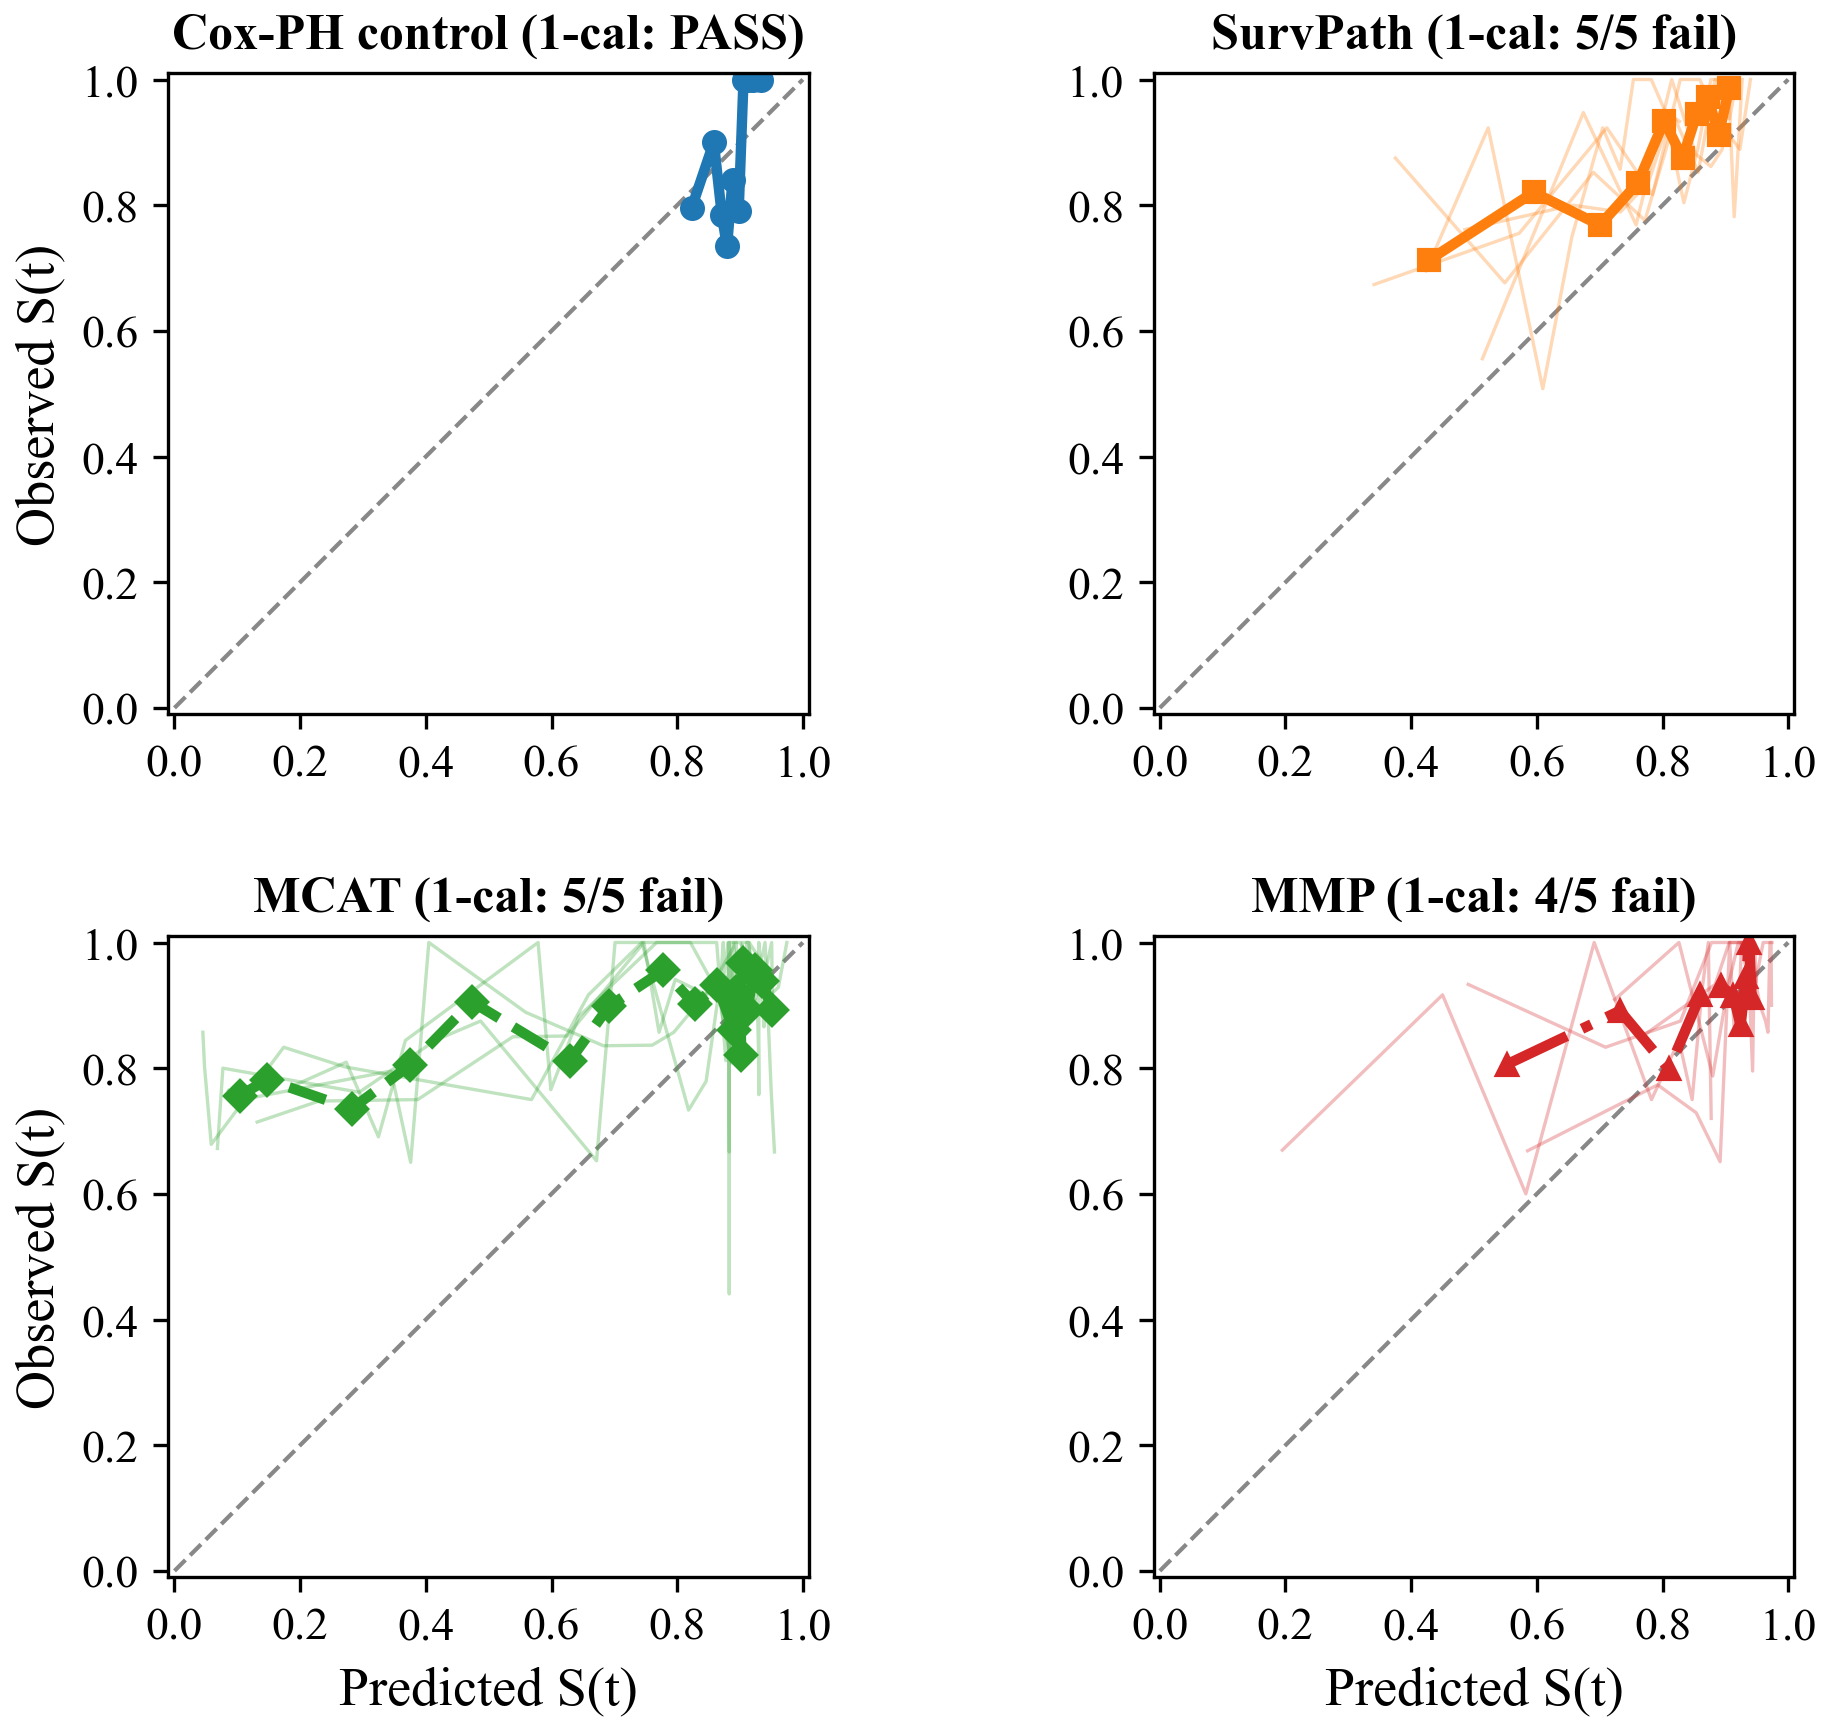 Figure 1: Calibration curves on TCGA-BRCA at median event time (~42 months).
4.2 Multi-Cancer, Multi-Architecture Audit (Experiment B)
Of 290 fold-level tests, 166 survive Benjamini-Hochberg correction at FDR = 0.05.
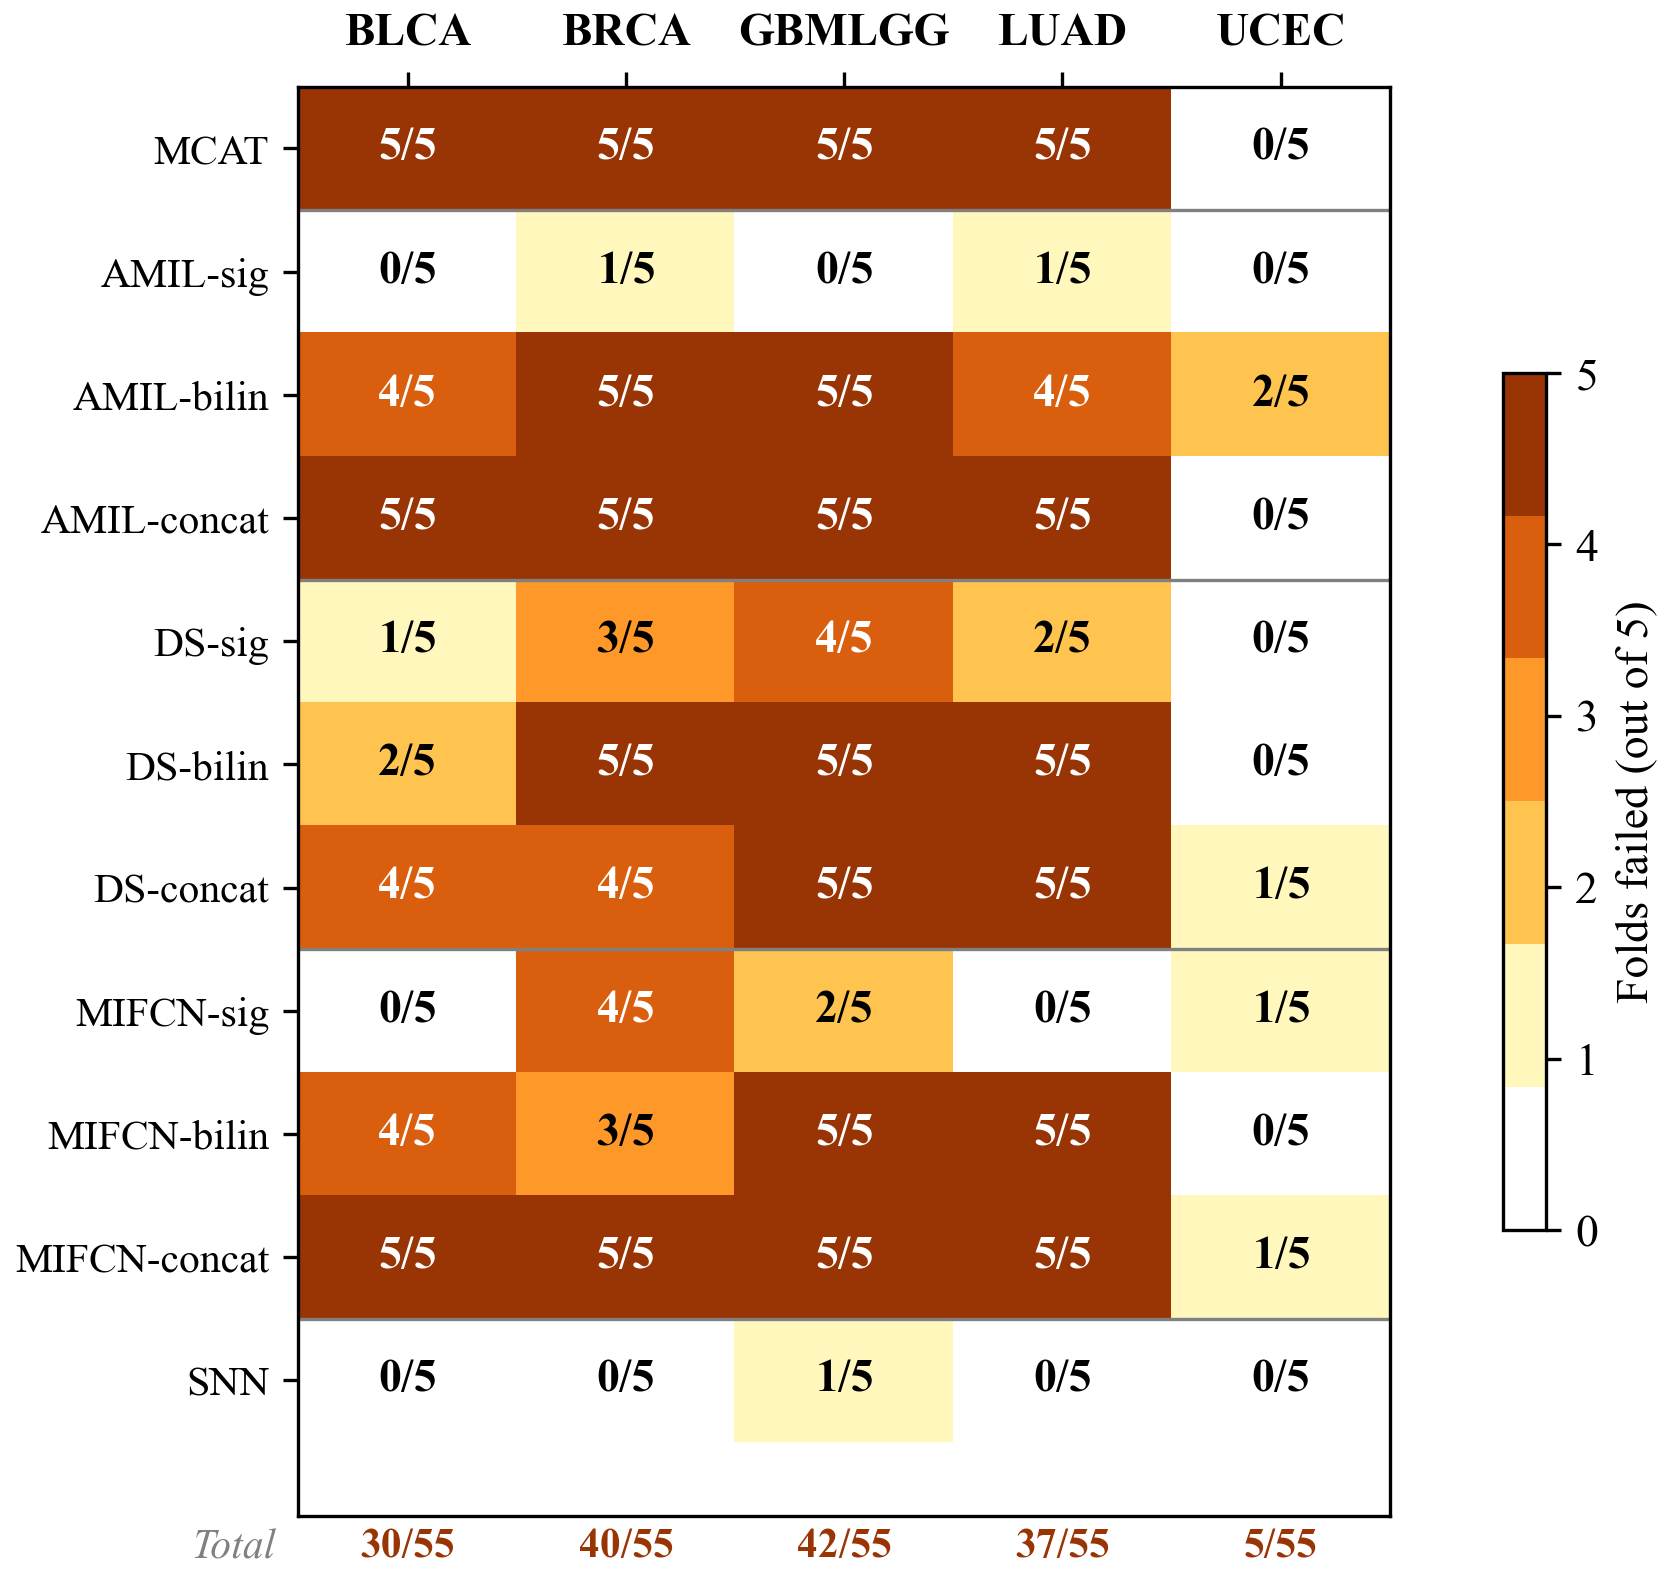 Figure 2: 1-calibration failure heatmap (BH-corrected) across 11 architectures and 5 TCGA cancer types.
Cancer type matters. GBMLGG: 42/55 failures (C-index 0.817). BRCA: 40/55. LUAD: 37/55. BLCA: 30/55. UCEC: 5/55 (underpowered, ~15 events/fold).
Fusion method is the key variable:
- AMIL: gating 2/25, bilinear 20/25, concat 20/25
- DS: gating 10/25, bilinear 17/25, concat 19/25
- MIFCN: gating 7/25, bilinear 17/25, concat 21/25
SNN (genomics-only): 1/25 failures. The fusion mechanism drives miscalibration.
Important caveat for Experiment B. Experiment B evaluates Breslow-reconstructed survival curves, not native model outputs. Part of the observed miscalibration may reflect the reconstruction step; see Discussion.
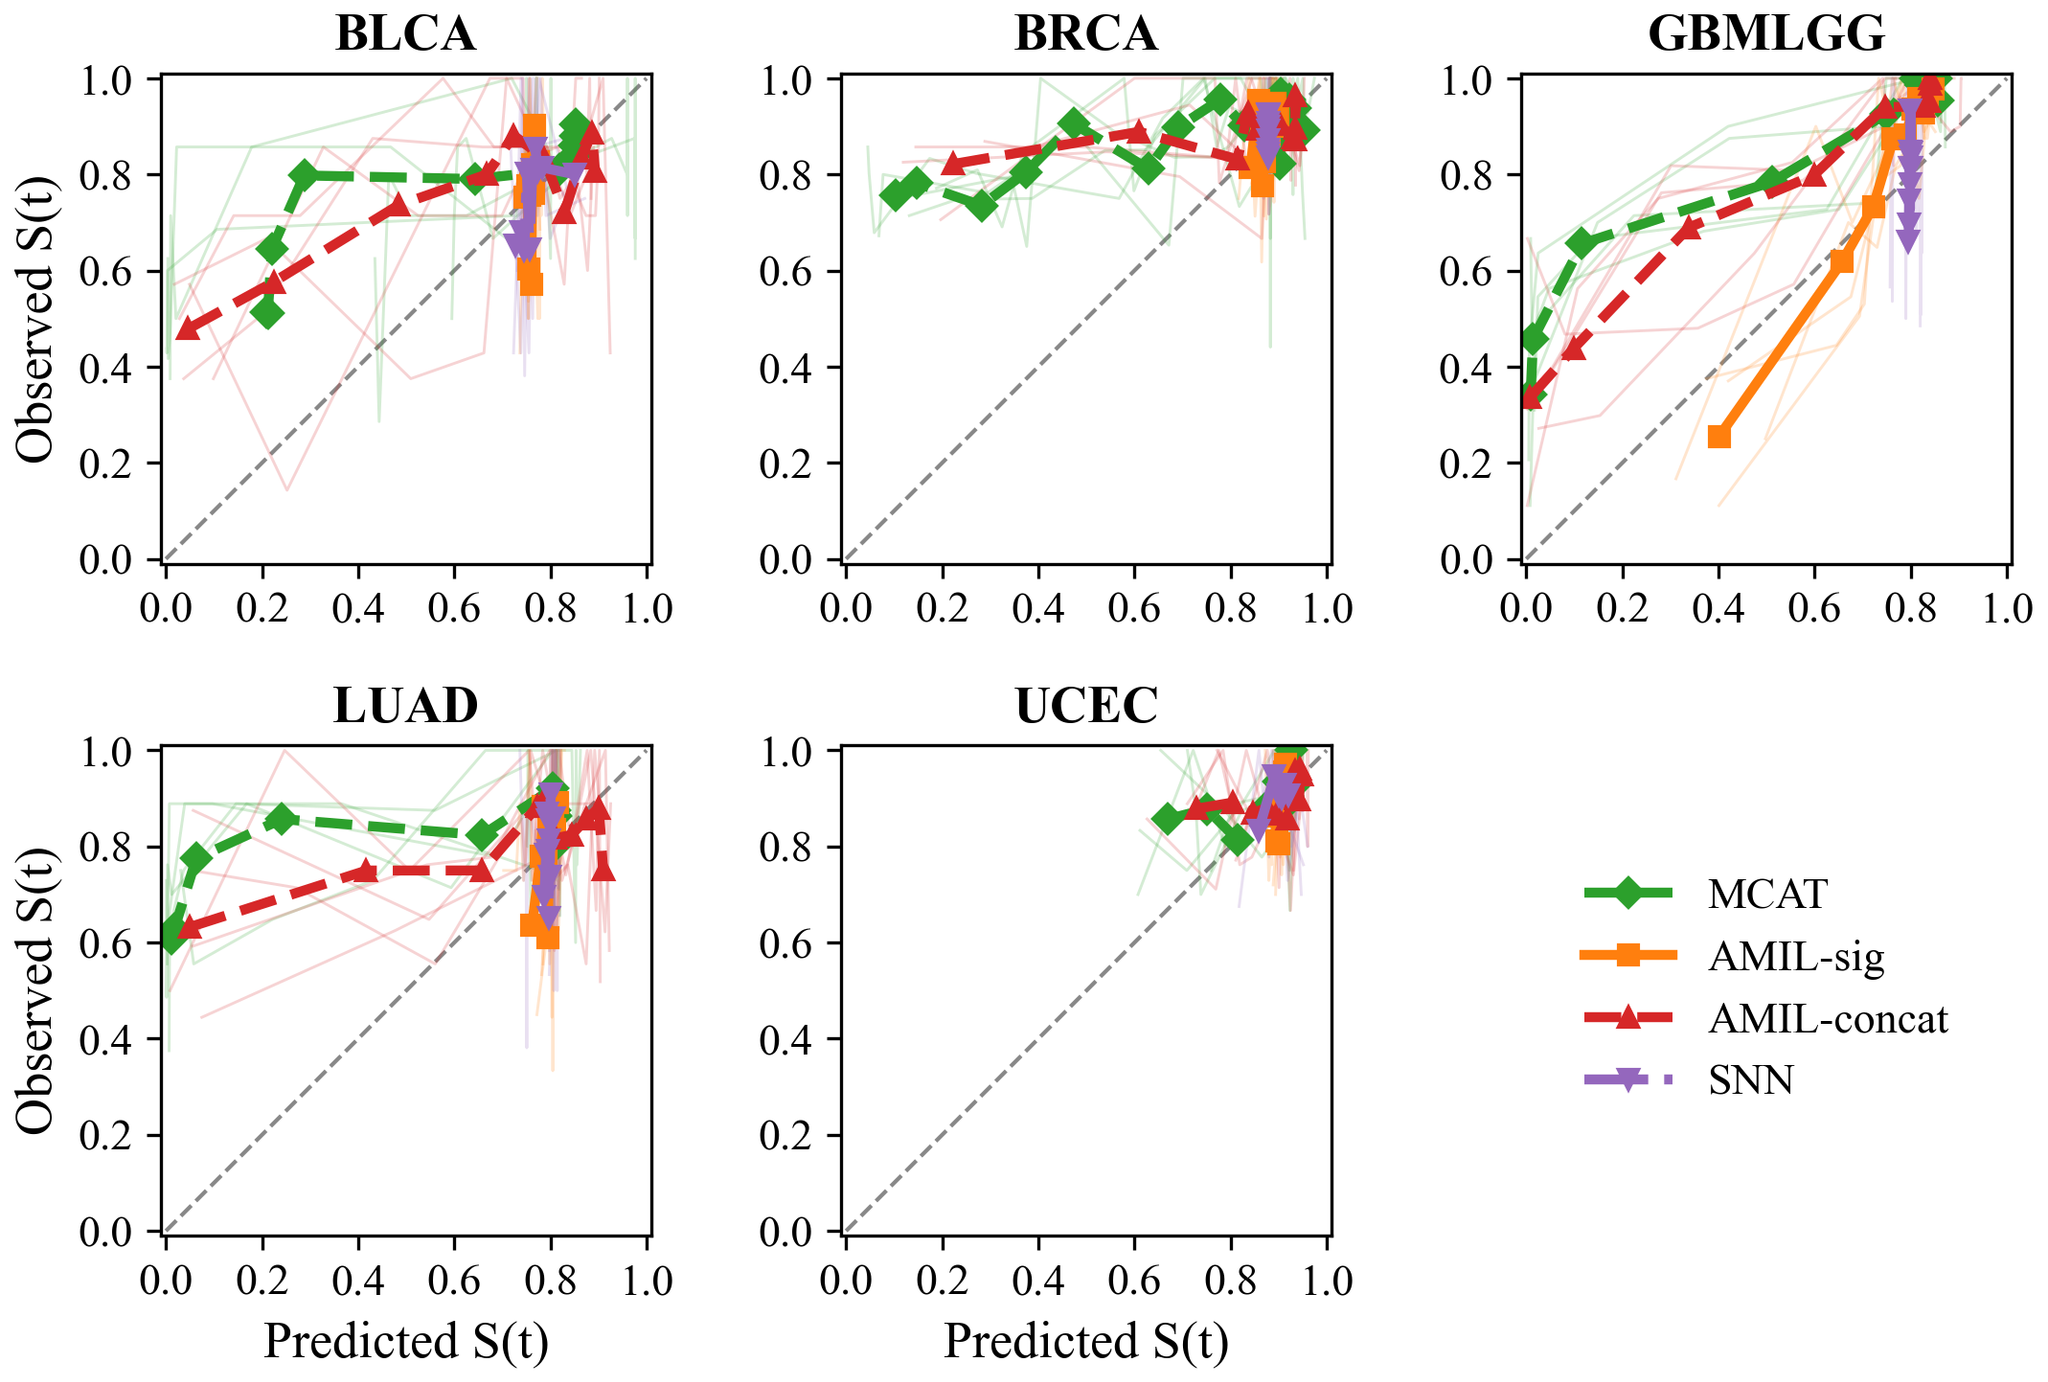 Figure 3: Calibration curves across 5 TCGA cancer types.
4.3 Post-hoc Recalibration
| Model | Original | Platt | Orig IBS | Platt IBS |
|---|---|---|---|---|
| SurvPath | 5/5 fail | 1/5 fail | 0.223 | 0.216 |
| MCAT | 5/5 fail | 2/5 fail | 0.311 | 0.219 |
| MMP | 4/5 fail | 3/5 fail | 0.120* | 0.127* |
Table 3. Recalibration results. *MMP fold 4 excluded. C-index unchanged (monotonic transform).
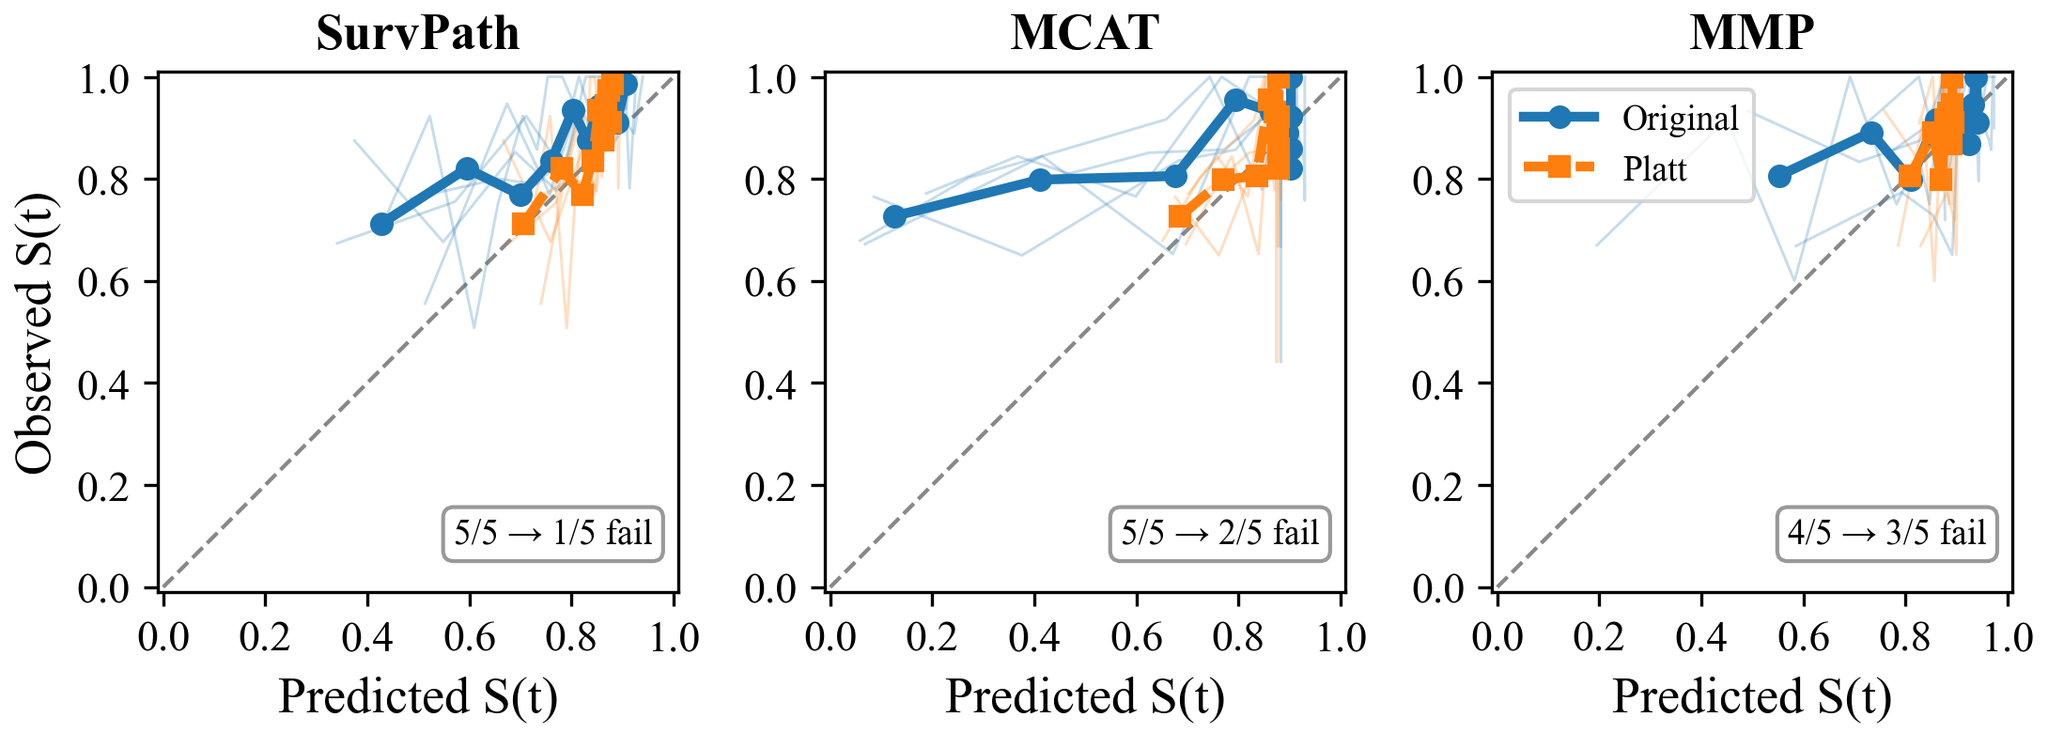 Figure 4: Calibration curves before and after Platt scaling.
5. Discussion
Two levels of evidence. Experiment A provides direct evidence: all three NLL-trained models fail calibration from their native outputs. Experiment B provides broader but more indirect evidence via Breslow-reconstructed curves across 11 architectures and 5 cancer types. Calibration failures on BRCA appear under both UNI v1 (Experiment B) and UNI2-h features (Experiment A), suggesting the feature extractor alone does not explain the problem.
Why are these models miscalibrated? NLL discrete survival loss rewards correct ranking but does not penalize miscalibrated probabilities; the 4-bin discretization compounds the issue. Calibration-aware losses exist - X-CAL (Goldstein et al., 2020) - but none tested on multimodal WSI-genomics models. That Platt scaling fixes the problem with two parameters hints that even a modest calibration term in the loss could help.
Gating-based fusion is consistently associated with better calibration across all three architecture families and five cancer types. Gating applies a constrained multiplicative mask; bilinear and concatenation create higher-dimensional interaction spaces that may distort the probability mapping. This remains a hypothesis; the current design cannot establish a causal mechanism.
GBMLGG is the poster child: C-index 0.817 yet 5/5 folds fail. Good ranking does not mean reliable probabilities.
Recalibration helps at the evaluated horizon. Platt scaling's effectiveness tells us the miscalibration is systematic, not random. A two-parameter correction largely fixes it. Since the scaler is fit at a single time point, improvement at other horizons is plausible but unverified.
Three recommendations: (1) report calibration metrics alongside C-index; (2) consider post-hoc recalibration before clinical use; (3) investigate calibration-aware training objectives.
These recommendations align with the FDA's January 2025 draft guidance, which discusses calibration and uncertainty among considerations for performance evaluation of higher-risk applications.
Limitations. Breslow assumes proportional hazards. 1-calibration evaluates at one time point. Our power analysis shows the Hosmer-Lemeshow test exhibits inflated type I error at these sample sizes (17-21% rejection rate under the null at n = 15-37, vs. the nominal 5%); however, 166/290 rejections far exceed even the inflated null expectation (~58), so the overall conclusion is robust. IPCW weighting reduces effective sample sizes to 52-68% of actual under BRCA's 85% censoring. UCEC is underpowered. All results use TCGA data. Recalibration evaluated on Experiment A only. The fusion-calibration association is observational, not causal.
6. Conclusion
Across 290 fold-level 1-calibration tests spanning 11 architectures and 5 TCGA cancer types, 166 reject the null of correct calibration at the median event time after Benjamini-Hochberg correction. The pattern is consistent: models optimized for discrimination produce unreliable survival probabilities, gating-based fusion is associated with better calibration than bilinear or concatenation alternatives, and post-hoc Platt scaling recovers much of the lost calibration without affecting ranking accuracy. These findings argue for three practical changes: reporting calibration metrics alongside C-index, applying post-hoc recalibration before clinical deployment, and investigating calibration-aware training objectives for multimodal survival models.
Appendix A. Cohort Details
TCGA-BRCA: 1,004 patients. 149 deaths (14.8%), 855 censored (85.2%). Median survival among events: 1,274 days (~42 months). WSI: UNI2-h ViT-H/14, 1,536-dim.
MCAT ICCV cohorts: BLCA (~375), BRCA (~960), GBMLGG (~570), LUAD (~455), UCEC (~480).
Appendix B. D-calibration Analysis
All models produce 4-bin discrete survival curves. D-calibration lacks power: shuffled predictions pass (p = 0.80), while 1-calibration correctly rejects (p = 0.0001).
Appendix C. Breslow Validation
KM-shift vs lifelines produce 1-cal p-values of 0.079 and 0.078. No artifacts.
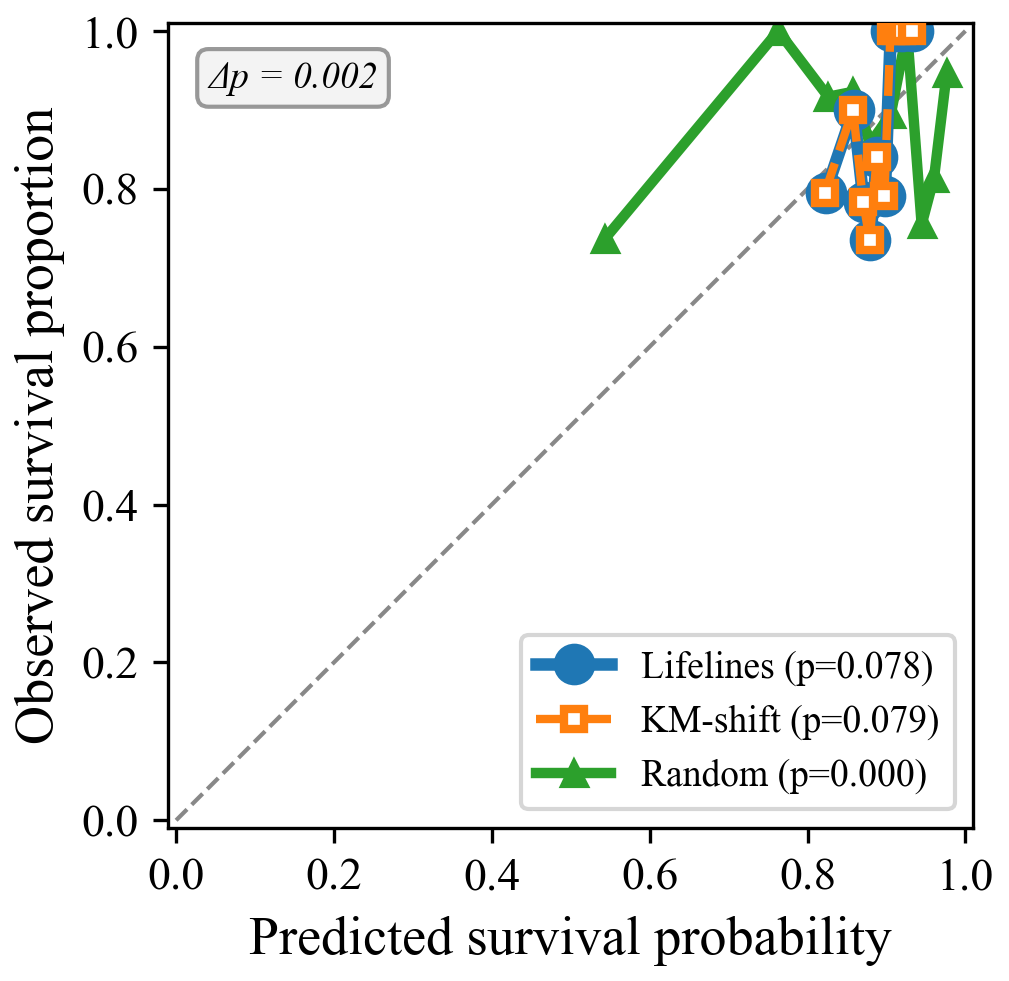 Figure 5: Breslow validation.